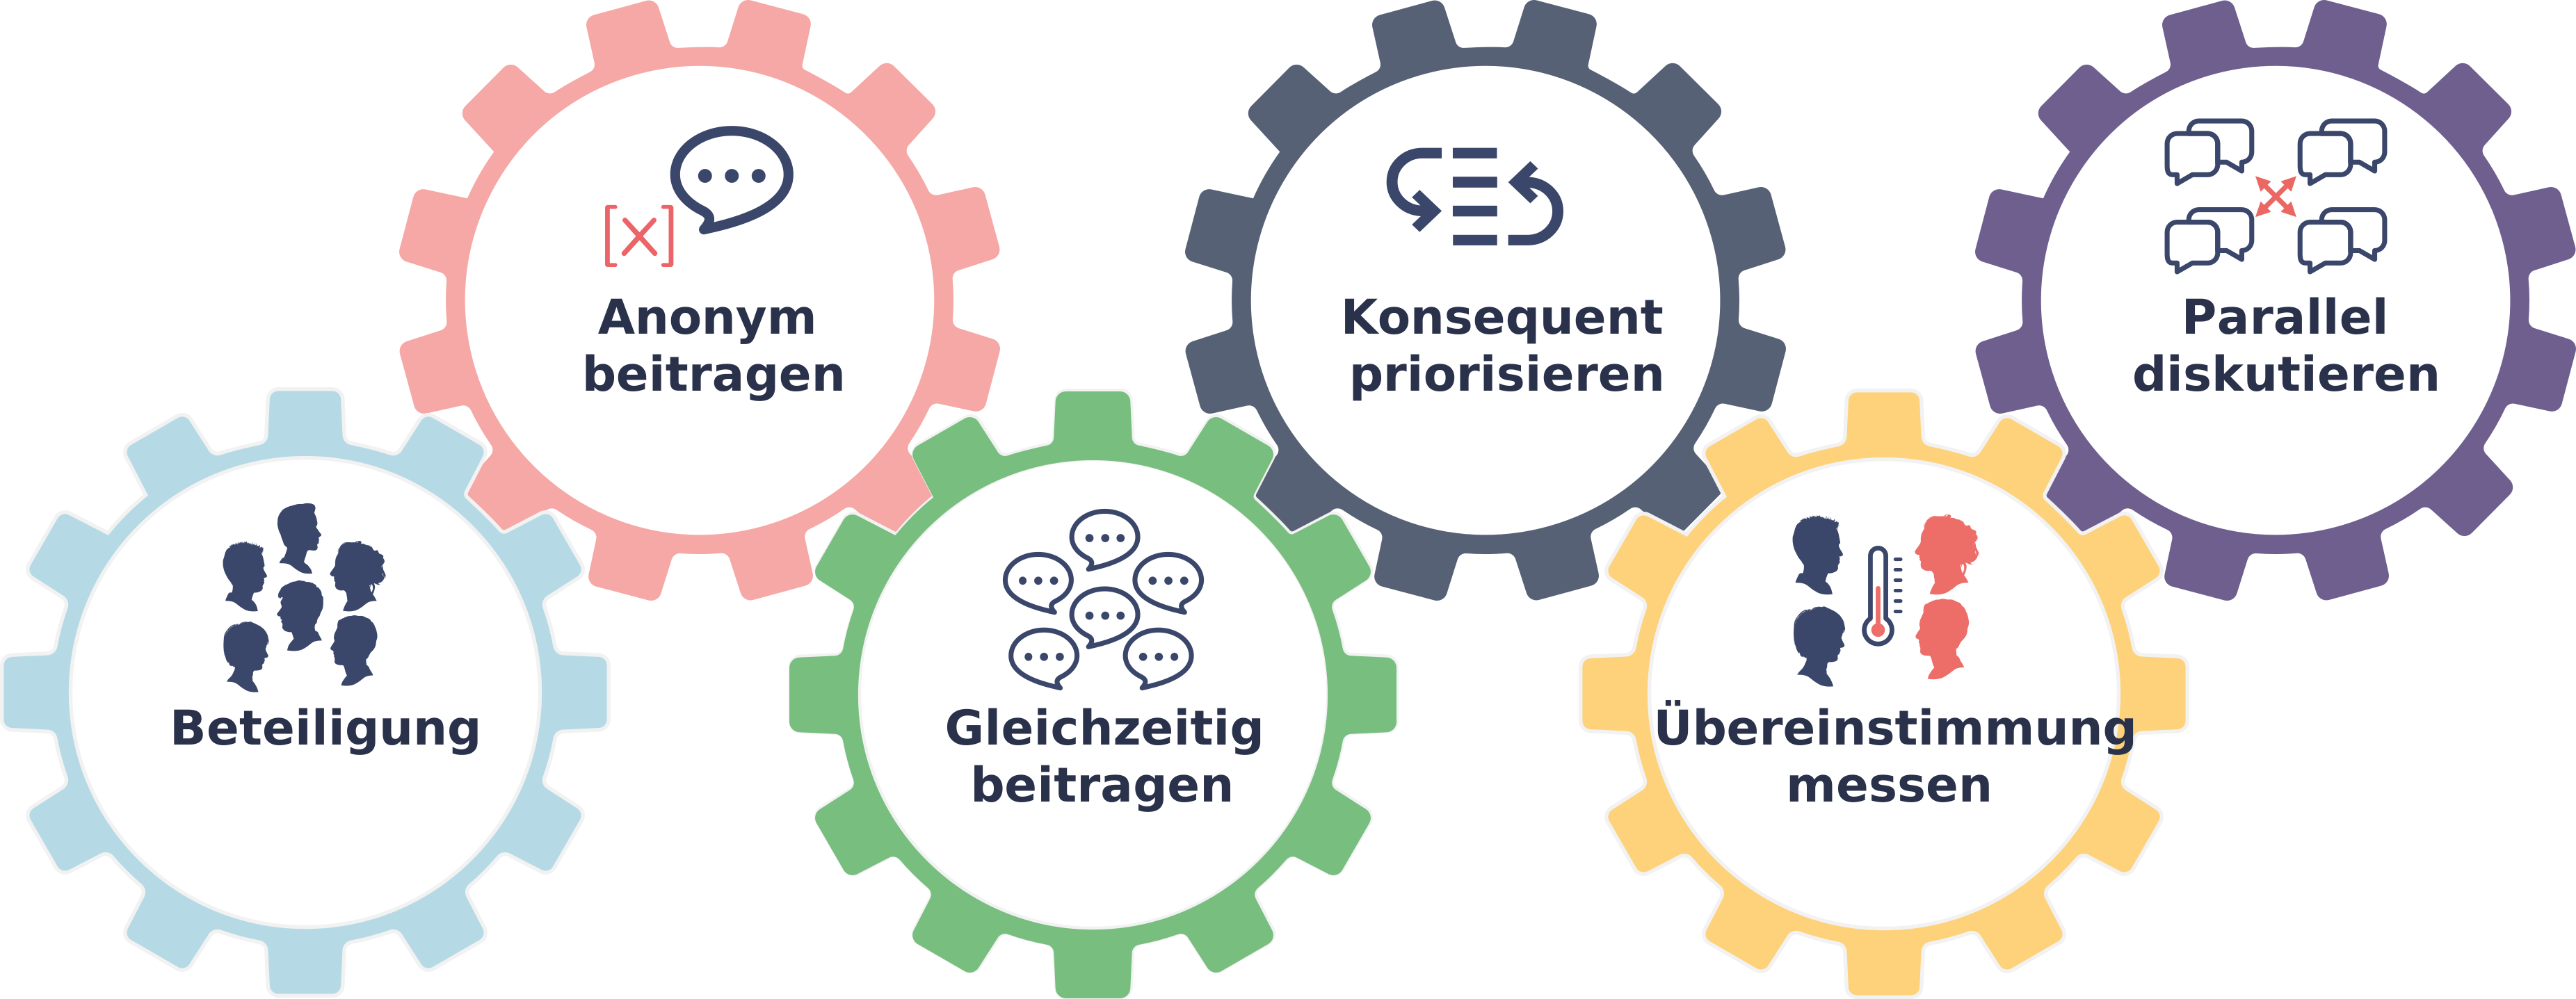
Stellen Sie sich 15 Teilnehmer vor, die 50 Ideen nach drei relevanten Kriterien bewerten. Um die Übereinstimmung in der Gruppe intuitiv zu erfassen, müssten weitgehend unspezifische verbale und nonverbale Signale in Echtzeit daraufhin gedeutet werden, wie nah die 2.250 einzelnen Bewertungen beieinanderliegen.
Eine solche Interpretation einzelner Äußerungen und Körpersprache ist nicht sportlich, sondern unmöglich. Doch es geht nicht allein um Rechenkapazität. Mit Workshop-Mechanik von gestern ist nur ein Bruchteil der nötigen Informationen überhaupt wahrnehmbar.
Dazu kommt, dass sich sachbezogene und soziale Signale überlagern. Eine Reaktion kann sich auf die Sache beziehen – oder auf persönliche Konflikte, Loyalitäten, Status, frühere Positionen oder andere soziale Dynamiken in der Gruppe. Schweigen kann Zustimmung bedeuten, Scheu vor Widerspruch, Rücksicht auf Hierarchien oder einfach, dass jemand lieber nichts sagt. Worauf sich soziale Reaktionen beziehen und wodurch sie ausgelöst werden, lässt sich im Workshop nicht eindeutig erkennen – schon gar nicht fortlaufend in Echtzeit. Soziales Verhalten erschwert die Deutung genau der Signale, auf die Sie angewiesen sind.
Wenn Ihnen Teilnehmer unbekannt sind, wird die Einschätzung noch schwieriger. Ohne Vergleich mit ihrem üblichen Verhalten können Sie kaum beurteilen, ob jemand ungewöhnlich aufgebracht, abweisend oder begeistert ist – oder sich einfach wie immer verhält. Wenn Sie einige Teilnehmer besser kennen als andere, kommt eine weitere Verzerrung hinzu. Die Aussagen und Reaktionen vertrauter Teilnehmer lassen sich leichter einordnen und bekommen dadurch womöglich unverhältnismäßig viel Gewicht.
Videokonferenzen räumen vollends mit der Illusion auf, Einigkeit in der Gruppe ließe sich intuitiv erfassen.
Das Problem fehlender Informationen über die Übereinstimmung in der Gruppe ist strukturell. Die Folgen sind real. Die Empfehlung, Stimmungen und Reaktionen einfach noch feinfühliger zu deuten, mag gut gemeint sein. Sie ändert nichts am Informationsdefizit.