XLeap Rating

XLeap Rating helps your group set priorities, assess options, and make alignment or dissent visible—by rating items on one or several criteria. Rating is implemented as three tightly linked workspaces: Rating sheets to collect ratings, Results tables to analyze them, and Results charts to visualize selected results. Results are available immediately, so you can focus workshop time on what is most important.

  • Determine priorities
  • Assess ideas, opinions, facts, or options on one or several criteria
  • Make alignment and dissent visible

After Rating, you know where the group is aligned. Where opinions differ, you can decide whether this is acceptable—or whether it merits a closer look.

Host's view of Rating sheet with numerical scale

Rating sheets

Rating starts in the Rating sheet, where participants submit their ratings in parallel. Rate any list of items—for example, ideas collected in Brainstorm—using methods such as numeric scales, rank order, budget allocation, estimates, or multiple selection.

Ratings can be single- or multi-criteria. The host defines criteria and scales and can enable anonymity for individual submissions. When needed, ratings can also carry a participant-group tag (based on demographics such as department, company, or discipline). This makes it possible to compare priorities across groups and to see whether misalignment runs through the group as a whole—or primarily between internally aligned demographics.

Participants' Multi-criteria rating sheet

Results analysis

As soon as you close the Rating sheet, results are available immediately for analysis—so you can focus on the questions that matter:

  1. What received the highest ratings?
  2. What is irrelevant for the current objective?
  3. Where is the group aligned—and where not?

Results tables

Use the Results table for detailed analysis of ratings. Filter and sort items to identify the highest priorities, examine the distribution of ratings, and pinpoint where alignment is strong—or where opinions diverge.

Results tables support both single- and multi-criteria ratings. They also allow comparisons across participant demographics. This helps you see whether differences in assessment run through the group as a whole—or mainly between demographics (while each demographic is internally aligned).

Host's view of Results table for one criterion with details

Multi-criteria analysis

Multi-criteria analysis helps you evaluate options across several criteria at once and make trade-offs and synergies transparent. Define criteria, weight them as needed, and combine results into calculated indicator values—in real time.

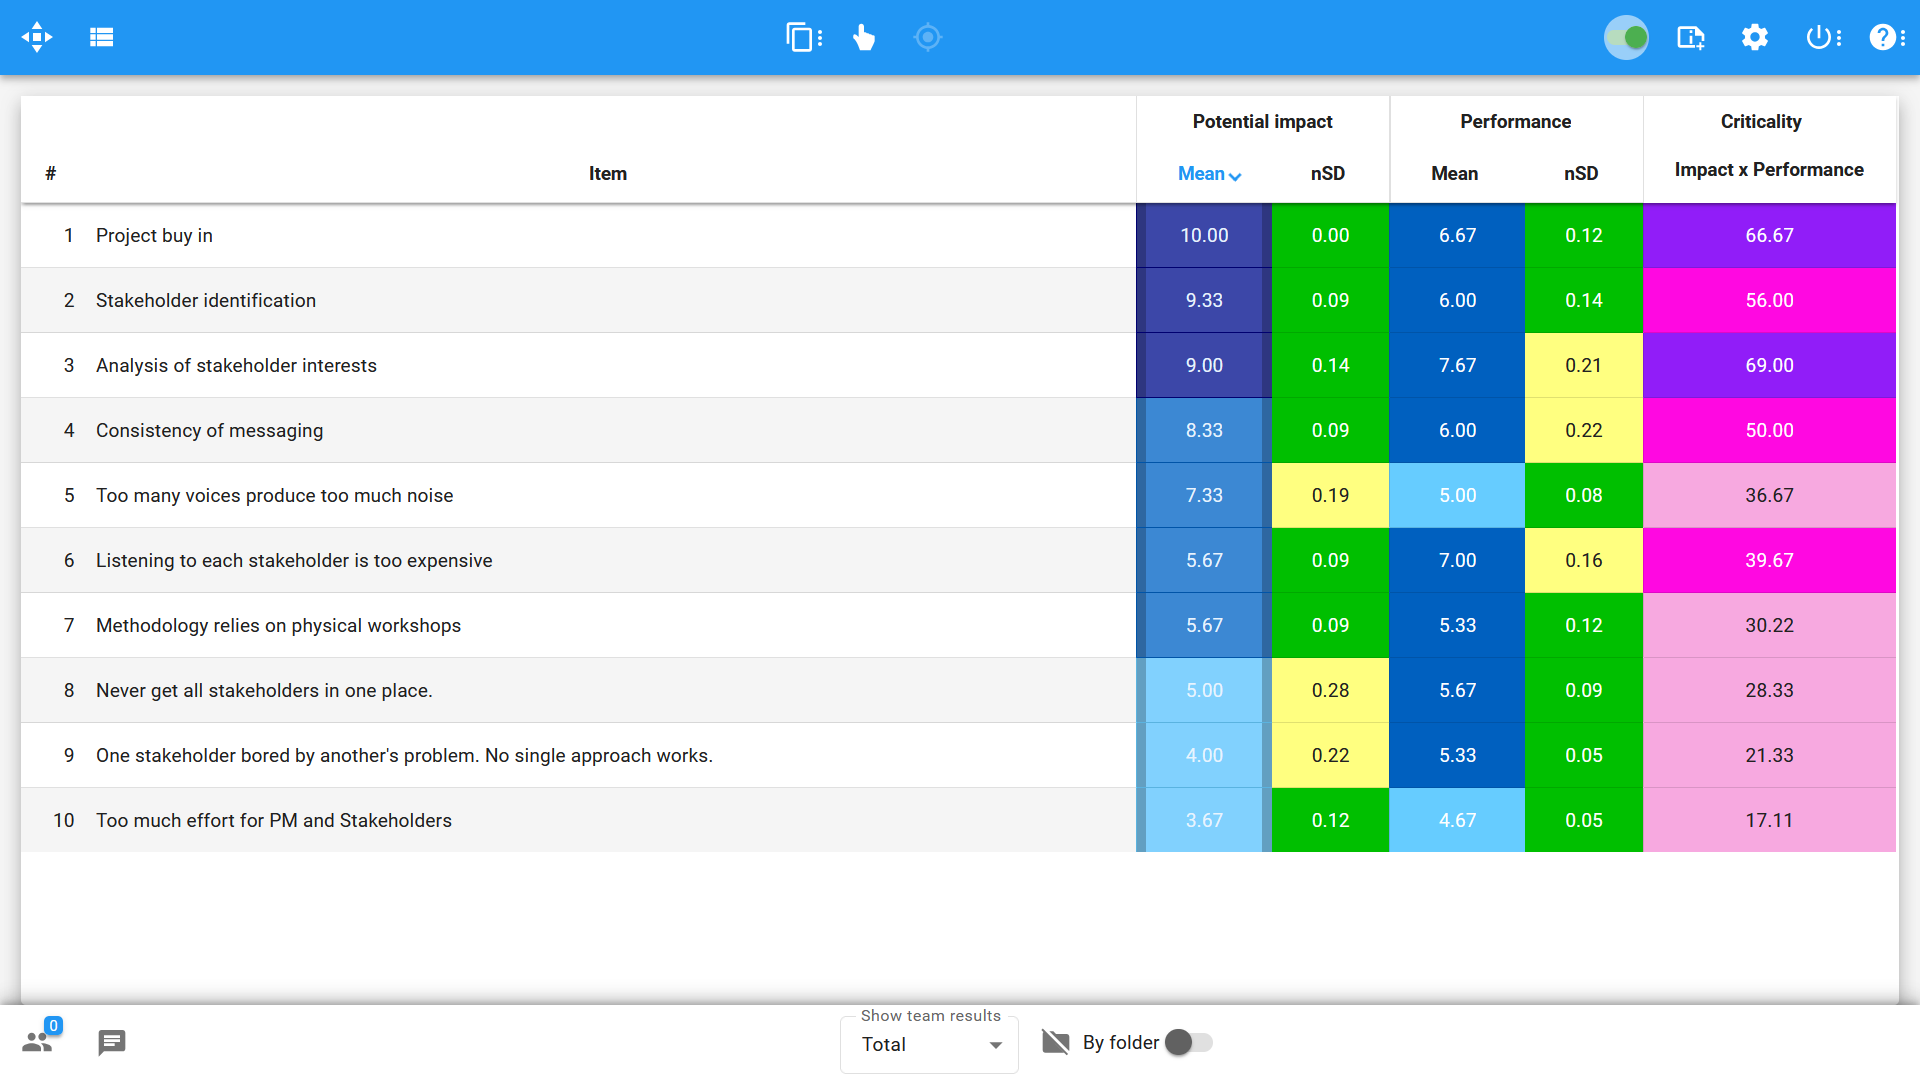
To support pattern recognition, hosts can apply conditional formatting—color-coding cells based on absolute or relative thresholds (for example, to highlight high, medium, and low scores across item/criterion combinations). Sensitivity analysis then lets you explore how changes to weights, assumptions, or thresholds affect the overall picture and which conclusions remain stable.

Real-time multi-criteria analysis keeps interpretation and decision-making in the workshop—so the group can discuss what the results mean and act on conclusions immediately.


Host's view of color-coded Multi-criteria results table with computed column

Results charts

Use Results charts to review ratings visually and quickly spot patterns. Charts visualize selected columns from the Results table—so you can focus on the criteria, indicators, or comparisons that matter for your purpose.

Chart types follow the rating method (for example, budget allocations are shown as shares). For multi-criteria assessments, heatmaps help interpret item/criterion patterns at a glance. You can also compare participant demographics against the overall result or against each other to see where priorities converge or diverge.

Again: real-time analysis keeps interpretation and decision-making in the workshop—so the group can discuss what the results mean and act on conclusions immediately.

Host's view of Multi-criteria results chart

Host's view of Multi-criteria results chart

Documentation - Export

Like all XLeap workspaces, Rating is self-documenting and included in the Word report available instantly.

For follow-up and reuse in other systems, export results to Excel. Results tables export with all underlying data for single- and multi-criteria ratings, so you can continue analysis or integrate outcomes into your existing tools.

Start with XLeap

Whether you can choose your own tools or want to establish XLeap across your organization, there is a straightforward way to get started.

For independent professionals

If you can choose your own tools, you can start using XLeap right away—with zero admin overhead.

  • Try XLeap free for 14 days
  • Personal onboarding included
  • Personal XLeap subscription: {cur}4,900 / year
  • 3 hours of training at no additional cost
Start your free trial
Subscribe now

For organizations

Talk to us about how you want to use XLeap, your deployment requirements, and rollout.

  • Use cases and workshop settings
  • Deployment options (Cloud, Managed, In-house/SCIF)
  • Information security & compliance
  • Onboarding and training for your team
Book a demo
Contact us

For education and non-profits

Educational institutions and non-profit organizations receive special terms with XLeap.

Get in touch—we’ll find the right model for your use case.  NON-PROFIT INQUIRY